The transfer of images from Firebase to your participants can incur a large cost due to the bandwidth required. Therefore, reducing the size of the images in your study can reduce the cost of running the study, and increase the participants that can be served under the free tier of Firebase.
Recommendation
Use JPEG (.jpg)
image files where possible.
The most effective image file formats for compression are the modern
image file formats such as
AVIF
or
WEBP.
These formats allow better compression of images. However, older and cheaper computers,
tablets, and phones may not support them. Therefore, it is recommended that
you use either the PNG (.png) or JPEG (.jpg) file formats for
images. These file formats are very widely supported.
Additionally, JPEG files can be compressed further than PNG files, and so JPEG images will often be smaller. Therefore, the use of JPEG images is recommended. However, sometimes JPEG files can introduce visual artifacts to some images. If you observe this, then using PNG files instead will avoid those at the cost of additional file size.
If you wish to include animated images in your study, you may use the
GIF (.gif) image file format. However, these images can be very large,
and The Misinformation Game does not support more efficient video formats.
Recommendation Downscale your images to the dimensions recommended in the Study Configuration Documentation using a tool such as iloveimg.com.
The easiest way to reduce the size of images is to downscale them to smaller dimensions. This reduces the number of pixels that must be stored for the image, which reduces their file size. However, if images are downscaled too far, then they will look pixelated. The Study Configuration documentation contains recommendations for the dimensions to downscale avatar and post images to. You can then use the tool https://www.iloveimg.com/resize-image to resize your study images to the recommended sizes before adding them to your study configuration spreadsheet.
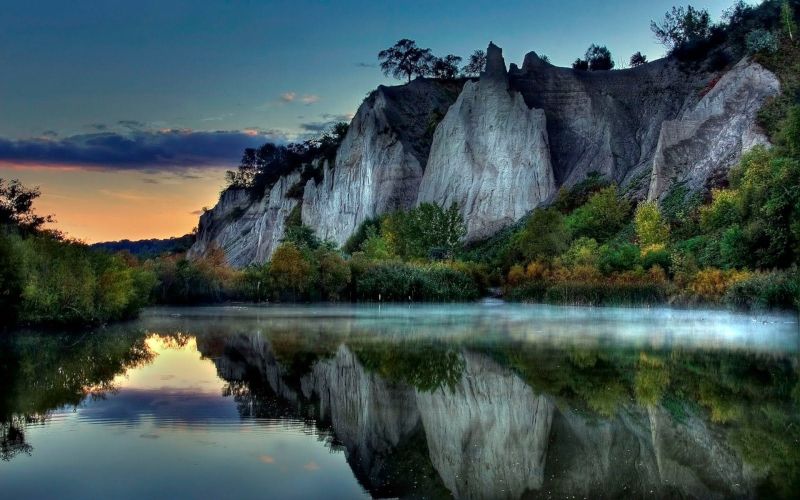
As an example, the two images below in Figure 1 and Figure 2 should appear very similar. However, the image in Figure 2 is half the width and height of the image in Figure 1, and therefore also only 30% of the size. This demonstrates that downscaling images can save a lot of bandwidth without noticeably affecting the quality of the images.
Original Image:

Scaled-Down Image:

Recommendation Use a tool such as imagecompressor.com to compress your image files before including them in a study.
Images can also be compressed without reducing their dimensions by reducing their quality. This compression can be done by automated tools such as https://imagecompressor.com/. The output of these tools is often imperceptibly different from the original image, especially when the image is a photo. However, it is recommended that you compare the image to the original after compression to make sure it hasn’t lost too much quality.
As an example, the two images below in Figure 3 and Figure 4 should appear very similar. However, the image in Figure 4 has been compressed, and has a 16% smaller file size than the image in Figure 3. This demonstrates that compressing images can save some bandwidth without noticeably affecting the quality of the images.
Original Image:
Compressed Image:
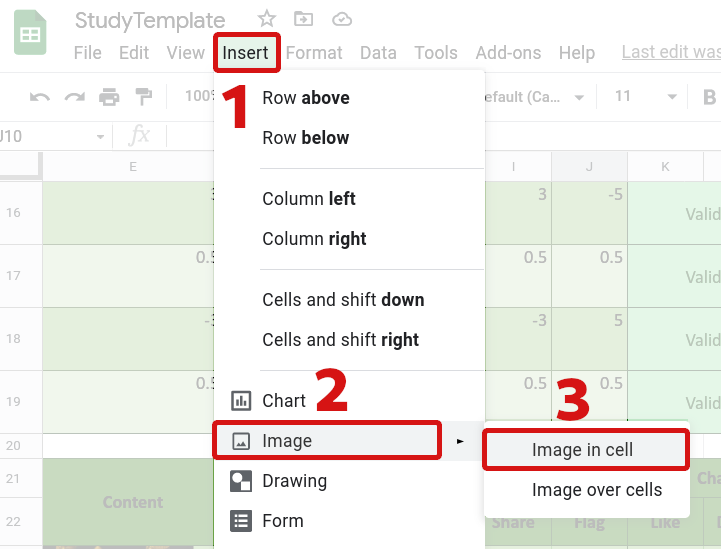
Images must be inserted into the configuration spreadsheet using the Insert menu at the top of the page in Google Sheets. You must first select the cell where you want to insert the image, and then select Insert -> Image -> Image in cell. This process is demonstrated in Figure 5. If you do not use this process, then The Misinformation Game may not be able to find the image.